
As an admin, you have access to dashboards to better understand your company's Verb data. Our three dashboards organize your Verb data by engagement, by learner, and by content.
Engagement Dashboard

At the top of your Engagement Dashboard, you'll see a graph comparing your count of registered learners and count of active learners over the last 21 weeks. This graph is static and will not change as you explore other date ranges. Below that, you are able to select a time period and explore four key metrics of engagement:
- Engagement - The percentage of your learners that were active on Verb in your selected time period. This includes any activity within the Verb platform, such as working through content, visiting bookmarks, interacting with team pages, exploring the Discover page, and more.
- Worked on an Activity - The percent of your learners that started or made progress on an activity in your selected time frame.
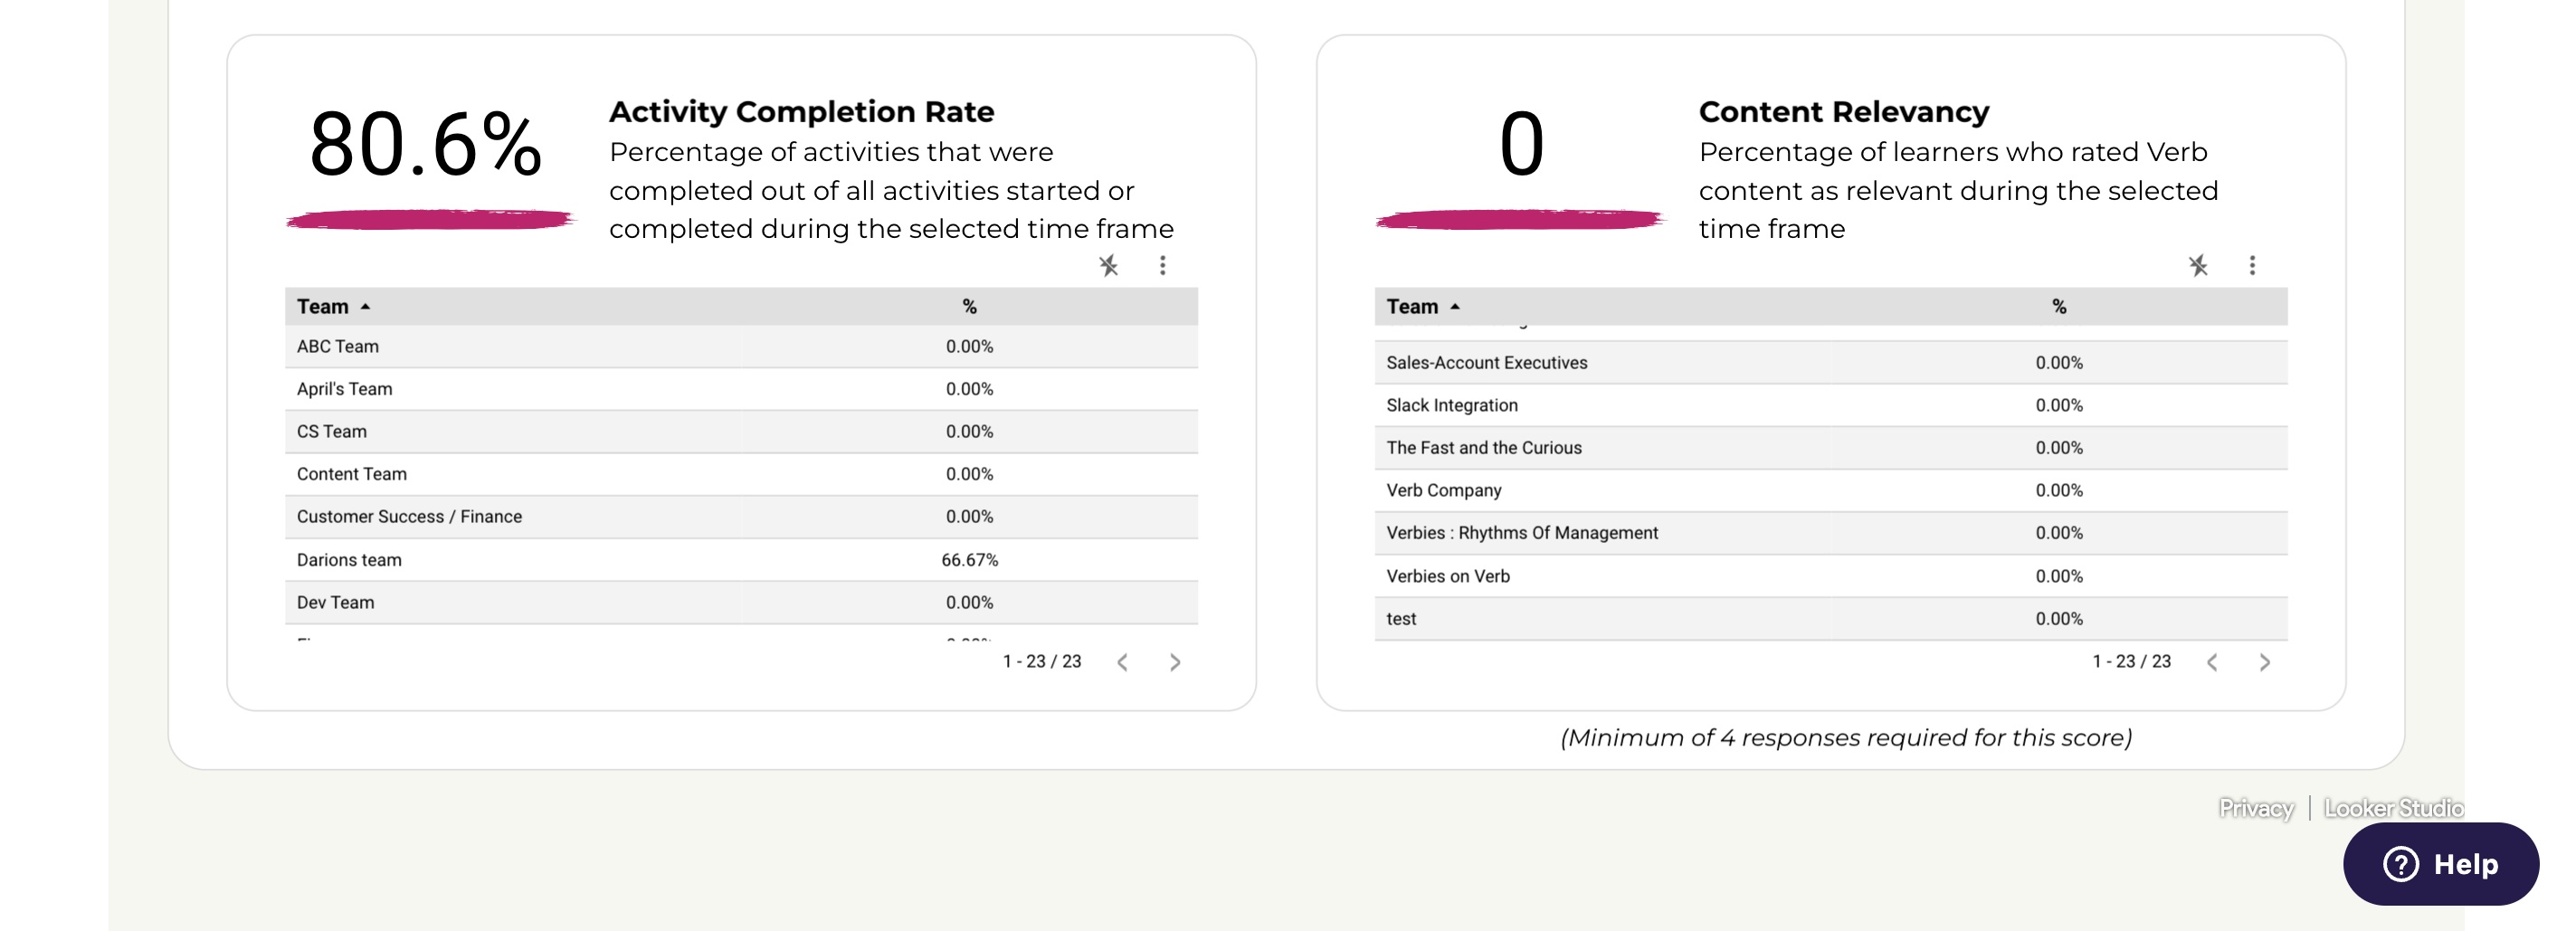
- Activity Completion Rate - The percentage of activities completed out of all activities worked on by your learners in your selected time frame.
- Content Relevancy - The percentage of your learners who rated Verb content as 'Relevant' when prompted in your selected time frame.
Each of these metrics can be viewed holistically by the number at the top of its section, or by individual team in the lines below.
Learner Drilldown
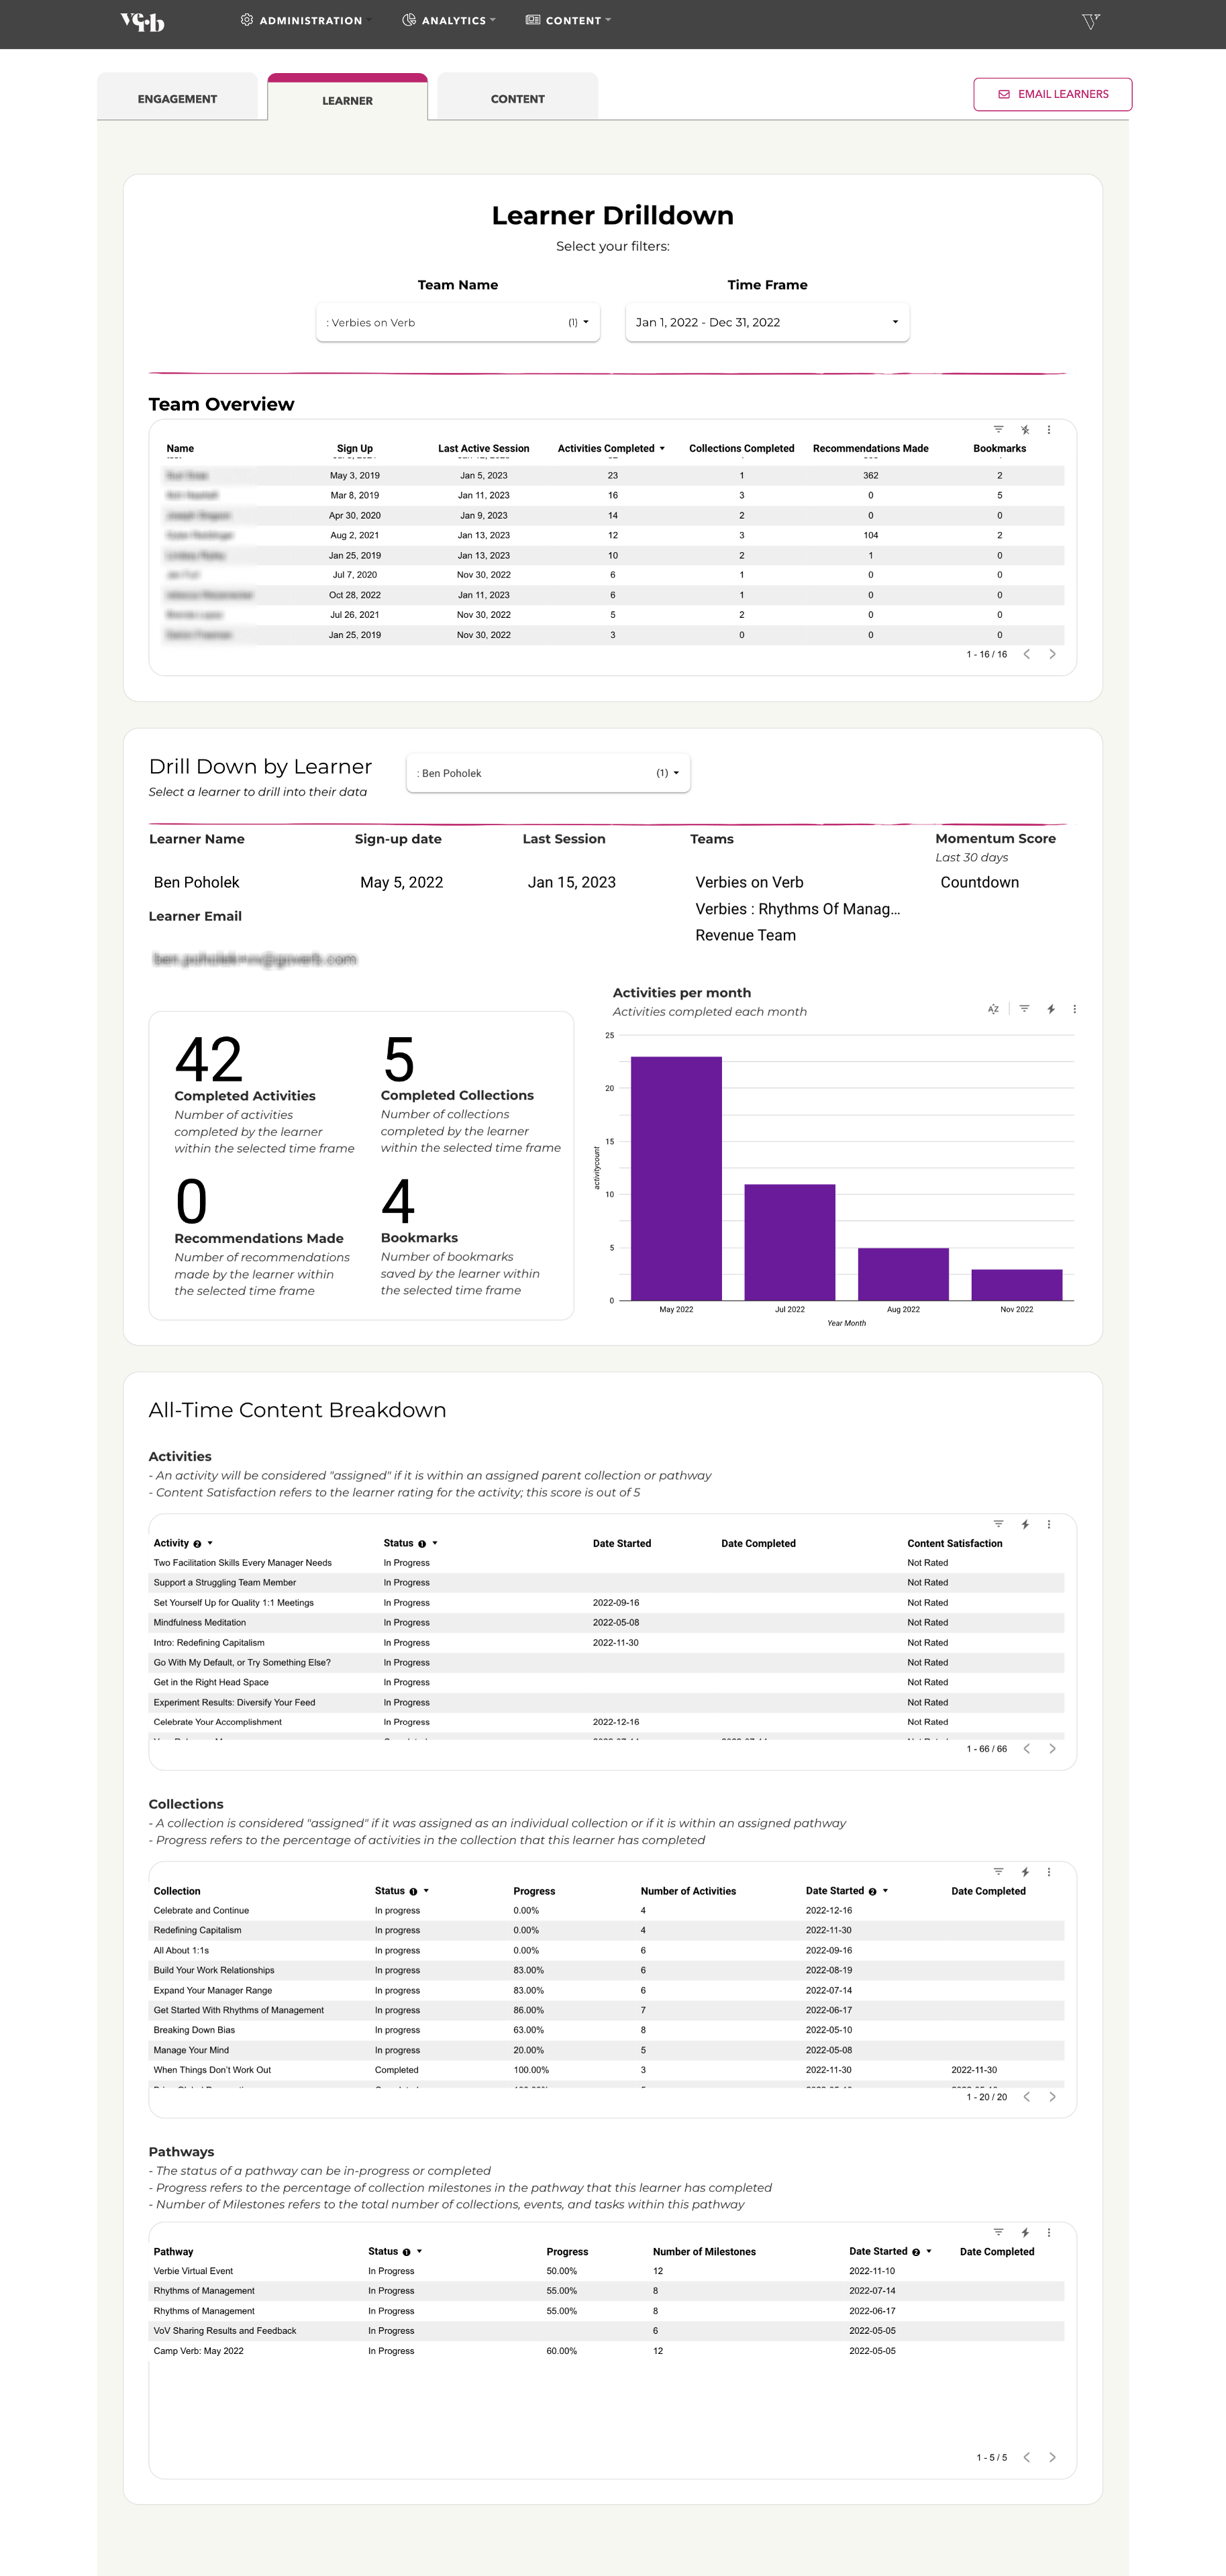
The Learner Drilldown allows you to see learner-specific data and drilldown into an individual learner's journey throughout your selected time period. At the top of the page, select what Team you'd like to view data for and choose your time frame to populate data in the "Team Overview" box.
To drill into a specific learner in the "Drill Down by Learner" box, select the learner's name from the dropdown. You'll see an assortment of statistics for the selected learner, and a graph representing how many activities the learner has completed each month in the last four months.
In the sections below, you'll be able to explore the content the learner has been assigned, started, or completed across the time they've worked in Verb. You'll be able to see the date your learner started and completed each activity, collection, or pathway, as well as their status of "In Progress," "Assigned," or "Completed." For collections and pathways, you'll also get a sense of their progress through the number of activities or milestones.
Content Drilldown
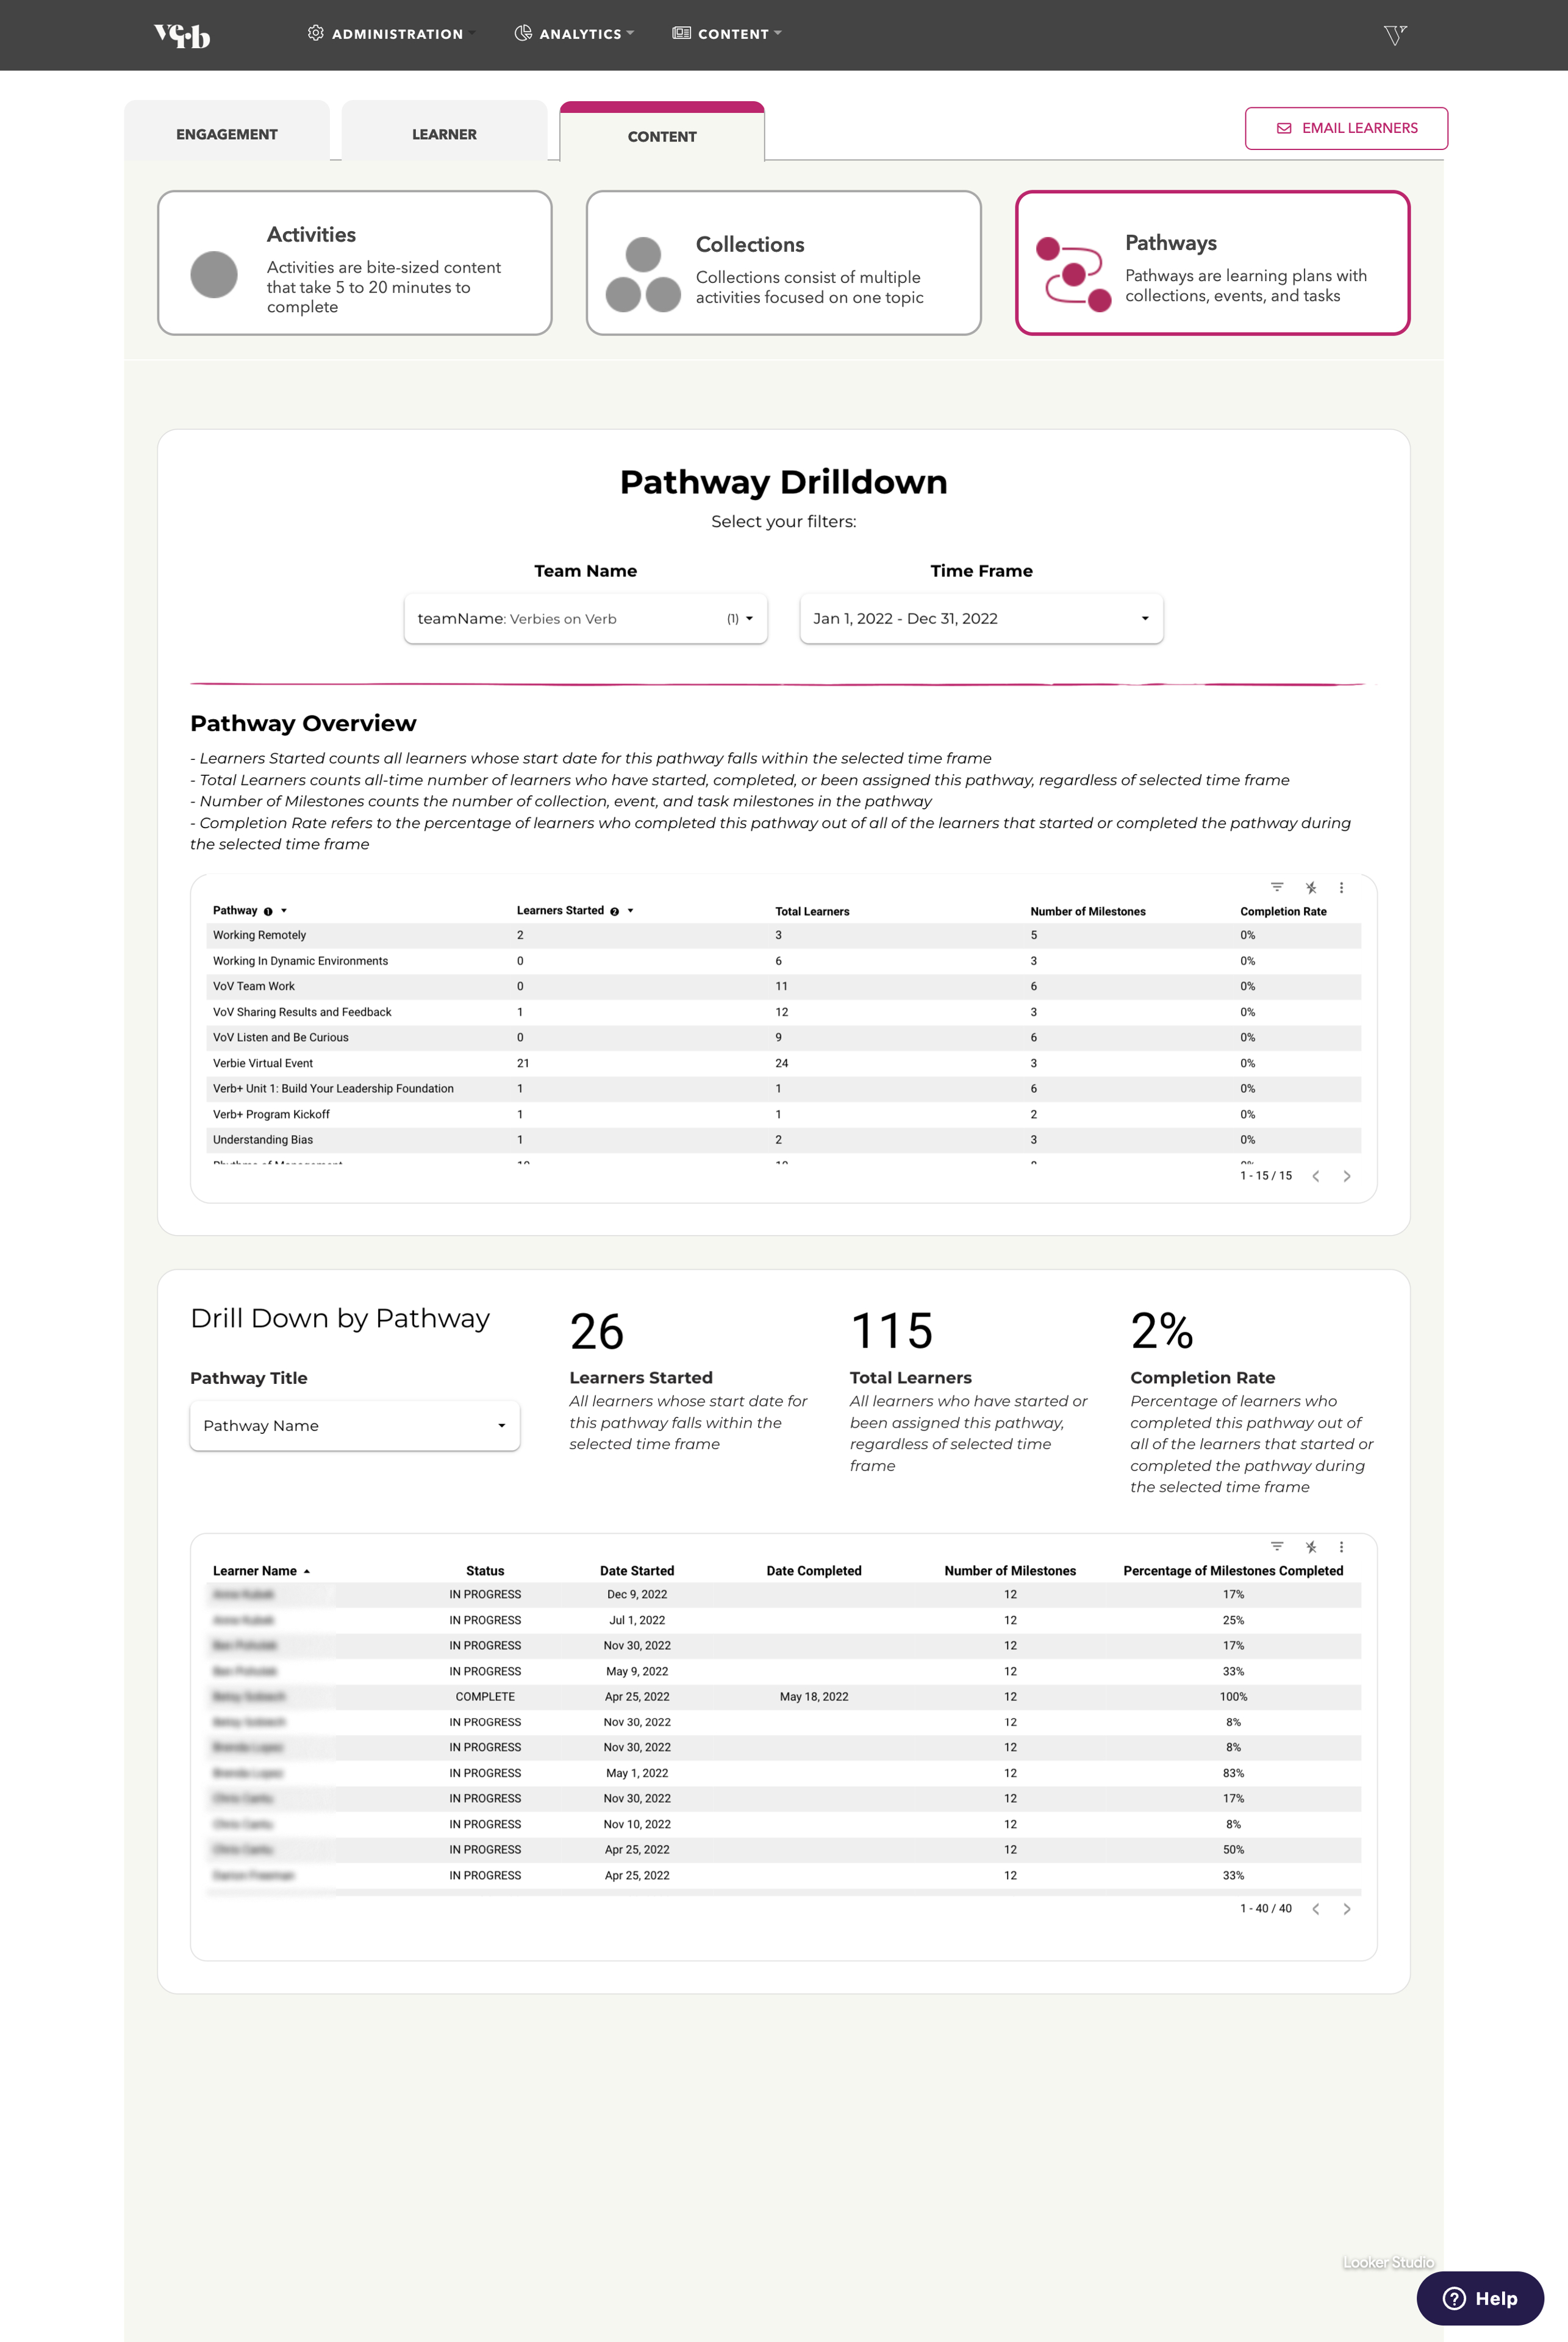
The Content Drilldown will allow you to look deeper into content completion for activities, collections, and pathways (need more info on the difference? Check out "Pathways, Collections & Activities"). Selecting between the tabs at the top will allow you to drill into each form of content, but for our purposes we'll use the "Pathway Drilldown" as our example, as each of these reports functions the same way.
From the top of the page, select the team and time frame that you'd like to view data for. In the "Pathway Overview" section, you'll see all of the pathways that learners in your company have worked on. The "Learners Started" column will show how many learners started the pathway in your selected time frame, while the "Total Learners" will show how many learners have worked in this pathway regardless of time frame. You'll also see the number of milestones (collections, tasks, or events) in each pathway, and the completion rate in your selected time frame.
In the bottom section, you'll be able to drill into a specific pathway's data by selecting a pathway in the dropdown menu. This will then show you information for each learner that has worked in this pathway in your selected time frame, including their status, start date, completed date, and progress.
Best of luck in exploring your Verb data! If you have any questions, feel free to reach out to customersuccess@goverb.com.